
“If you’re told what to look for, you can’t see anything else.” ~Edward Tufte
Map Key:
- Red X’s represent damage to local / regional chain stores.
- Grey X’s represent damage to national / international stores.
- Purple icons represent damaged schools, libraries, post offices, local food coops, community health clinics, etc.
- The Green dollar icon is the Federal Reserve Branch of Minneapolis (north-northwest of most damage).
- The Blue PD icon is the MNPD 3rd Precinct, which was destroyed by fire.
- Yellow polygon areas are the intersections of MN Opportunity Zones and riot damage. Note: There are several other Opportunity Zones that had no riot damage. See link below to view all Opportunity Zones in Minneapolis.
Total Devastation Area:
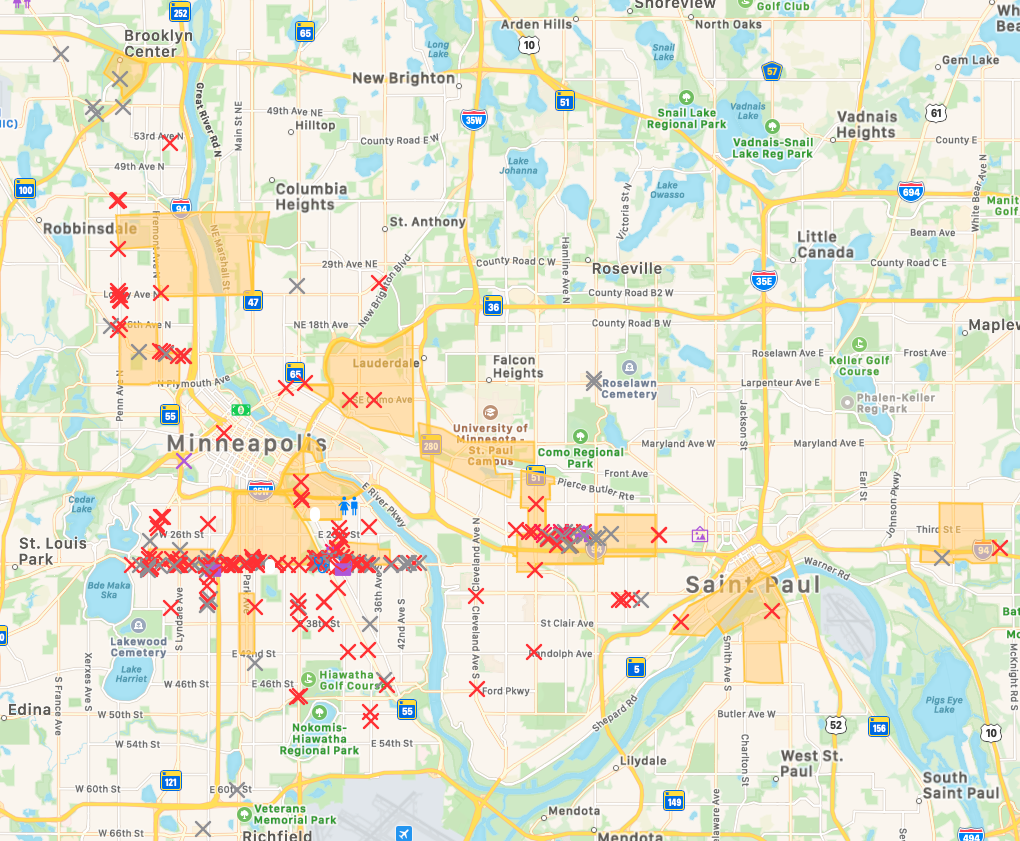
If you currently live in Minneapolis / St. Paul and you’d like to share riot-related information, please do so. I lived in Minneapolis for about a year during the 1st Tech Sector Bubble, so I’m familiar with the area. The majority of the riot damage appears to have been along the Lake Avenue Opportunity Zone corridor, where many a small minority business was laid to waste. The next cluster of damage appears to have been along the St. Paul University St. Opportunity Zone corridor. The damage here raises numerous questions. Note the apparent symmetry of the damage in some areas.
Lake St. Damage – A Closer Look:
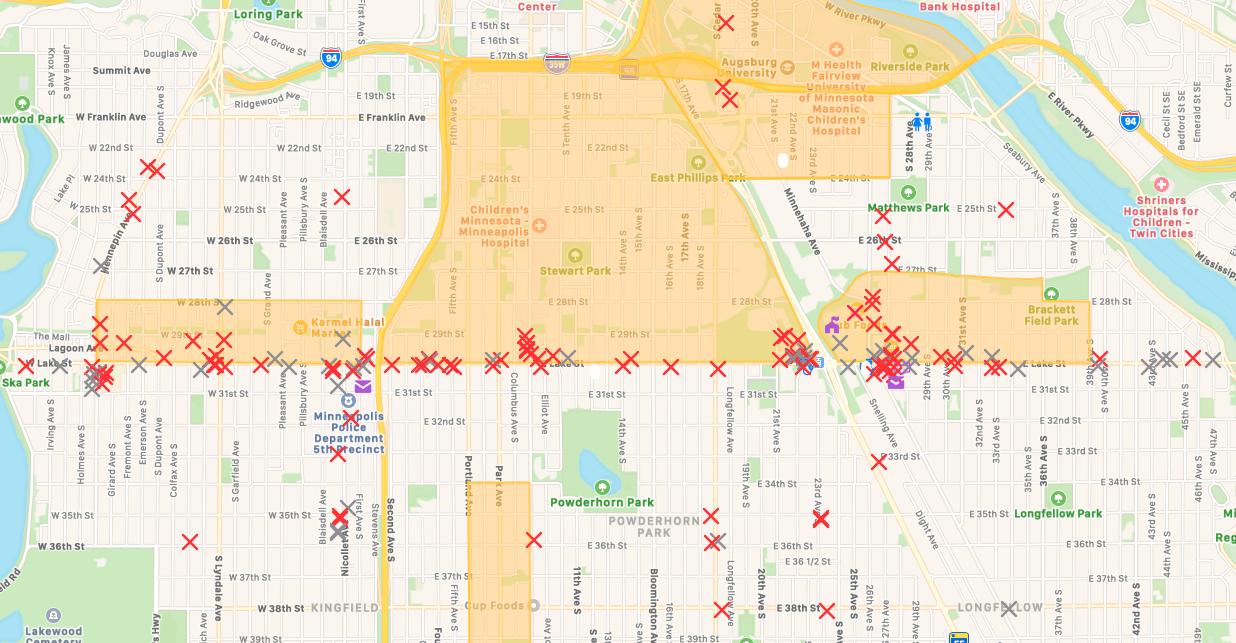
Lake St. is one of the older parts of town. An associate who is a MN native said that the houses here are roughly from the 1920s. Note the Red X’s: The majority of the damaged shops and businesses were definitely minority / small business / family operations that serviced a very multicultural part of town.
University Street, St. Paul – A Closer Look:
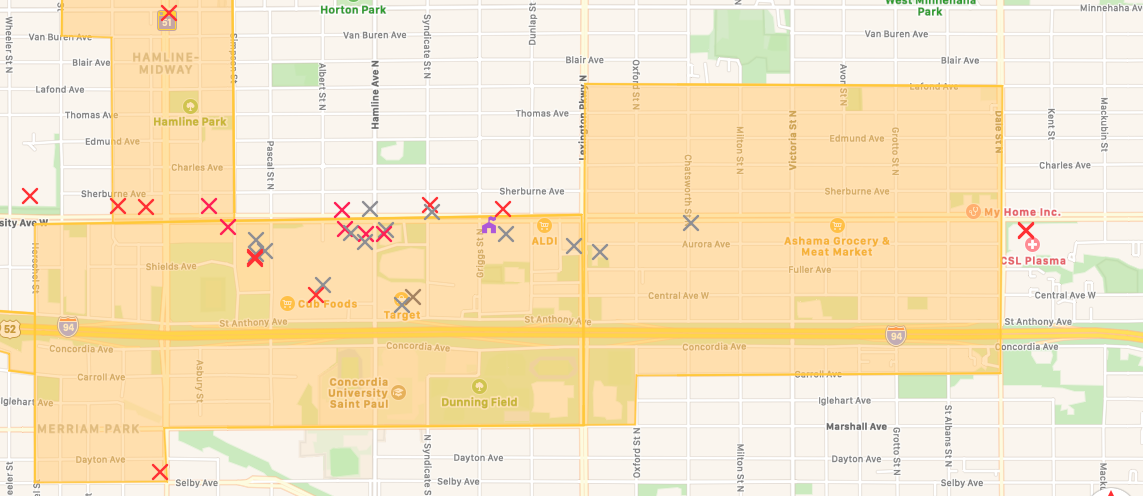
The St. Paul University St. Opportunity Zone had more national chains and fewer minority-owned businesses. However, the majority were still in the small local business category.
First-Glance Questions:
What will be the impacts of the Defund the Police / Social Justice Riots?
- Will middle class businesses and families flee to the perceived security of Red States?
- Will any of these small businesses rebuild under the current economic / geopolitical conditions?
- Will Wall St. firms, including those that have raised Opportunity Zone funds, buy up these small business concerns or real estate at war zone prices? With public QE funds?
- What will be the socioeconomic impact for those that remain?
In addition, with rents down from Covid-19, are there patterns of business owners engineering arson? It would be interesting to know the insurance patterns related to the damage done.
Updates:
- MN Legislature debates Police Reform and Riot Damage Funding
- Live USA Incident Map
- Kenosha WI Riot Map
- Mapping Omaha, NE Riot Damage, Opportunity Zones, and Fed Banks
- Mapping the Portland Oregon Riots
- Columbus, OH Riot Maps
Subscriber Resources:
Ahoy Maps can be downloaded from the Apple App Store on your Apple device. If you want to add to the map via the Ahoy Map app (5 locations or more), you’ll have to purchase the Pro edition for $4.99.
The Solari-generated Ahoy Map can be found here:
Link to Covid-19 Riot Damage
Opportunity Zone Map Source:
Information Request:
If you have detailed information about major riot damage, like the “Bring Me the News” link above, please let us know. Subscribers can post at Subscriber Input at Solari.com. If you are not a subscriber, please send to customerservice@solari.com. As always, we invite your input.


